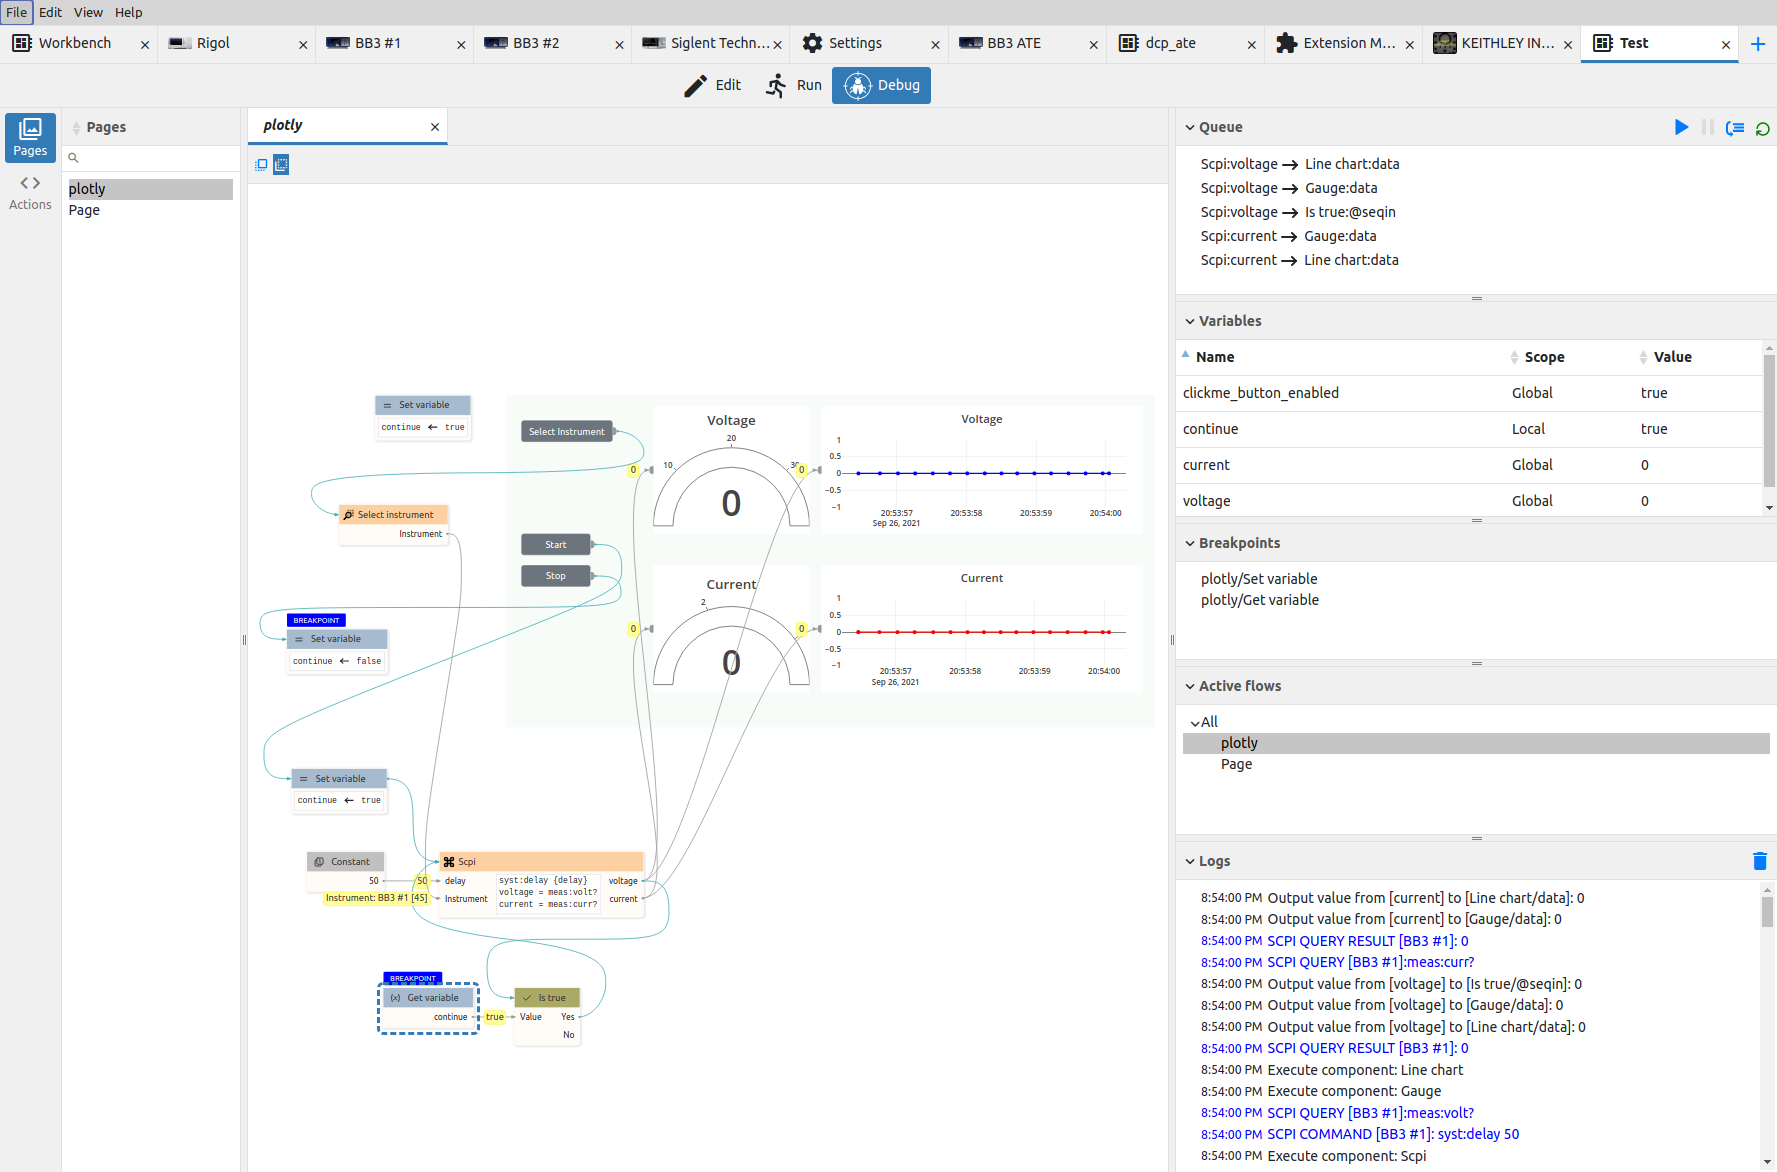
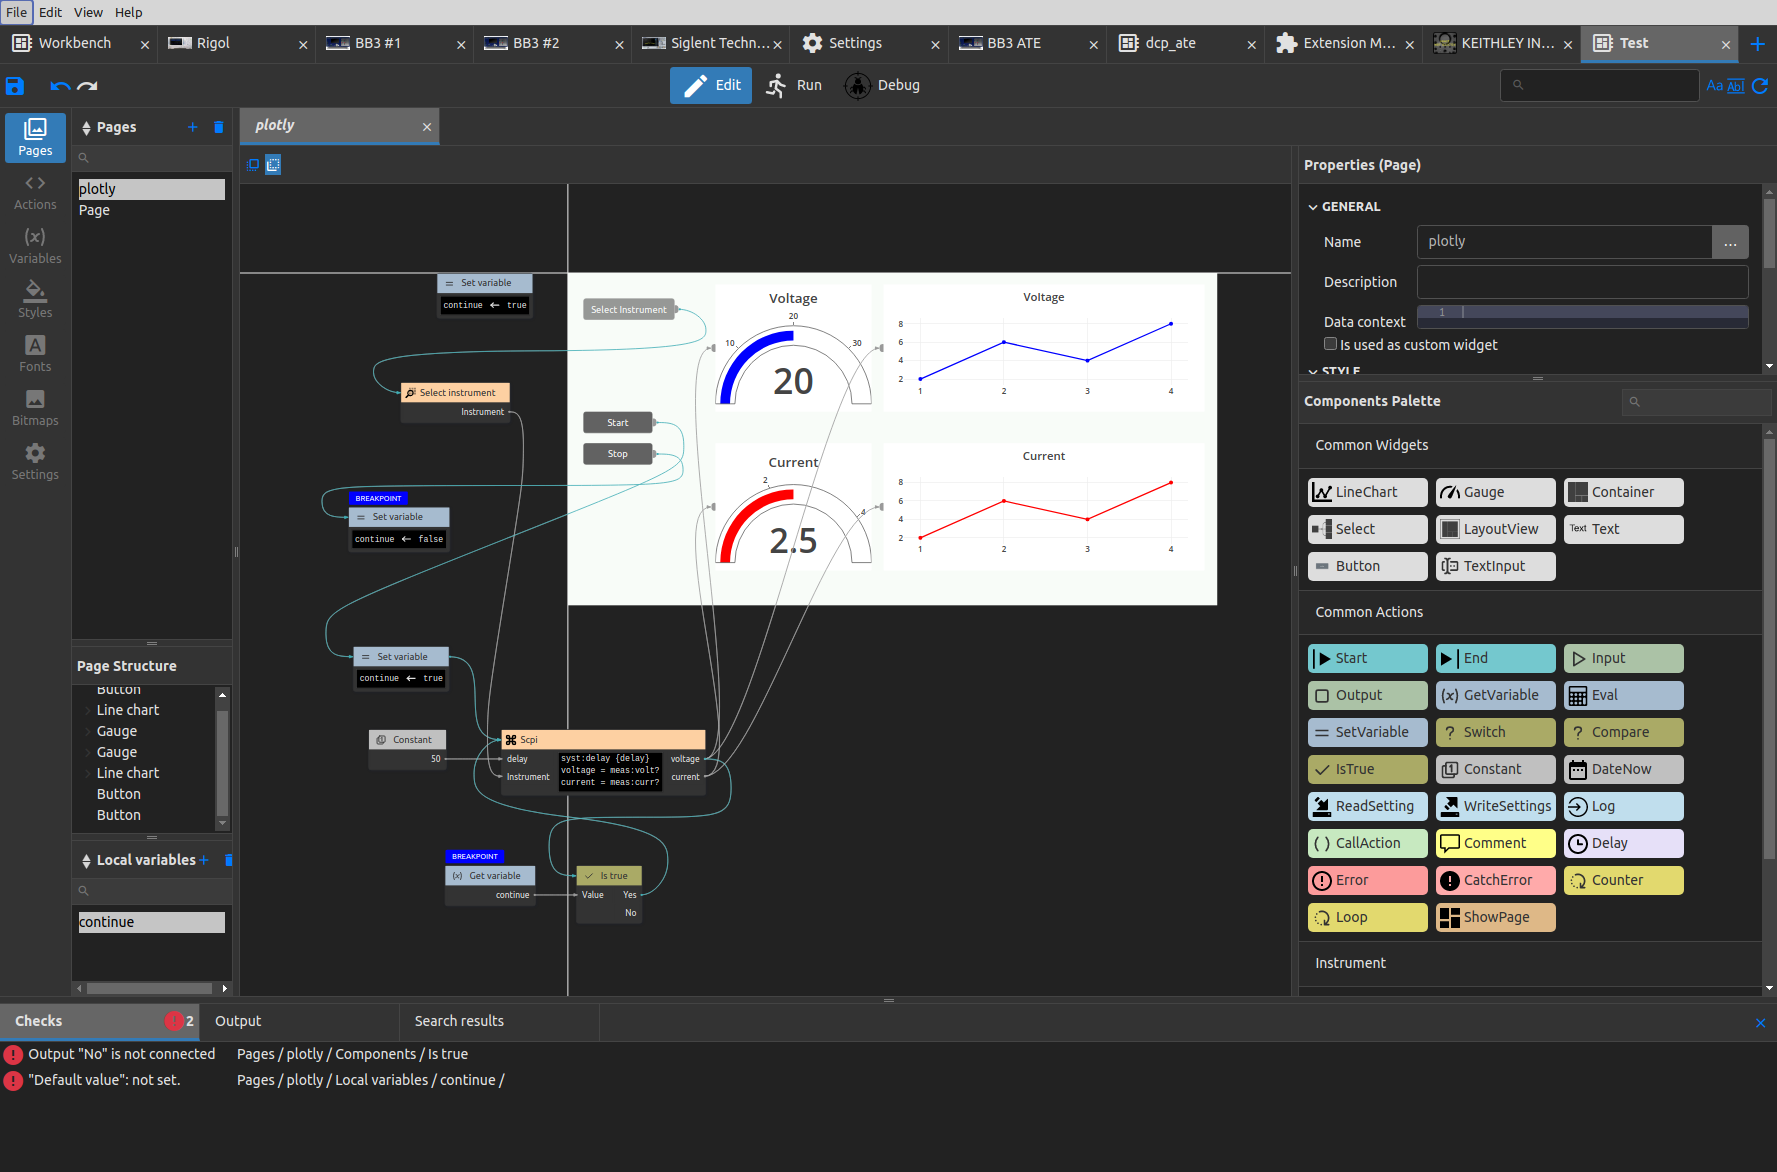
EEZ Studio in v0.9.86 pre-release (EEZ Flow Milestone 4) got a debugger, an important step towards a fully featured graphical development environment that we believe can become an attractive alternative to leading visual programming solutions for T&M equipment such as LabVEW and VEE.
Some time ago, we added integration for the EEZ BB3 T&M chassis with the popular open source Node-RED. There we really missed the debugger feature because the development of a slightly more complex flow required a lot of time due to the impossibility of executing in single step mode or adding a breakpoint.
Thanks to this milestone, EEZ Studio surpasses the capabilities of Node-RED and will allow users to more easily and quickly create a flow regardless of the complexity and number of instruments being controlled.
When flow is started in debugger mode, the following is displayed:
- Queue of components,
- Variables and their contents,
- breakpoints,
- Active flows and
- An activity log that also contains executed SCPI commands
Additionally in this milestone we decided to add a dark theme as well.
EEZ Flow Development continues thanks to NLnet as the main sponsor.


